It provides data from a range of countries and on helmet wearers, showing they have a higher arm injury rate.
'It doesn't use systematic methods when trawling the literature'
- the study includes data on arm injuries from 3 Australian studies.
'It doesn't use any statistical analysis'
- provides calculation on the overall accident rate per million hours cycled for NZ. It provides calculations on the relative serious injury rate for cyclists and pedestrians for various time periods in Australia. It provides details from Nova Scotia, Canada and details from the USA. Data from GB relates to changes in the fatal and serious accident rate per billion miles cycled.
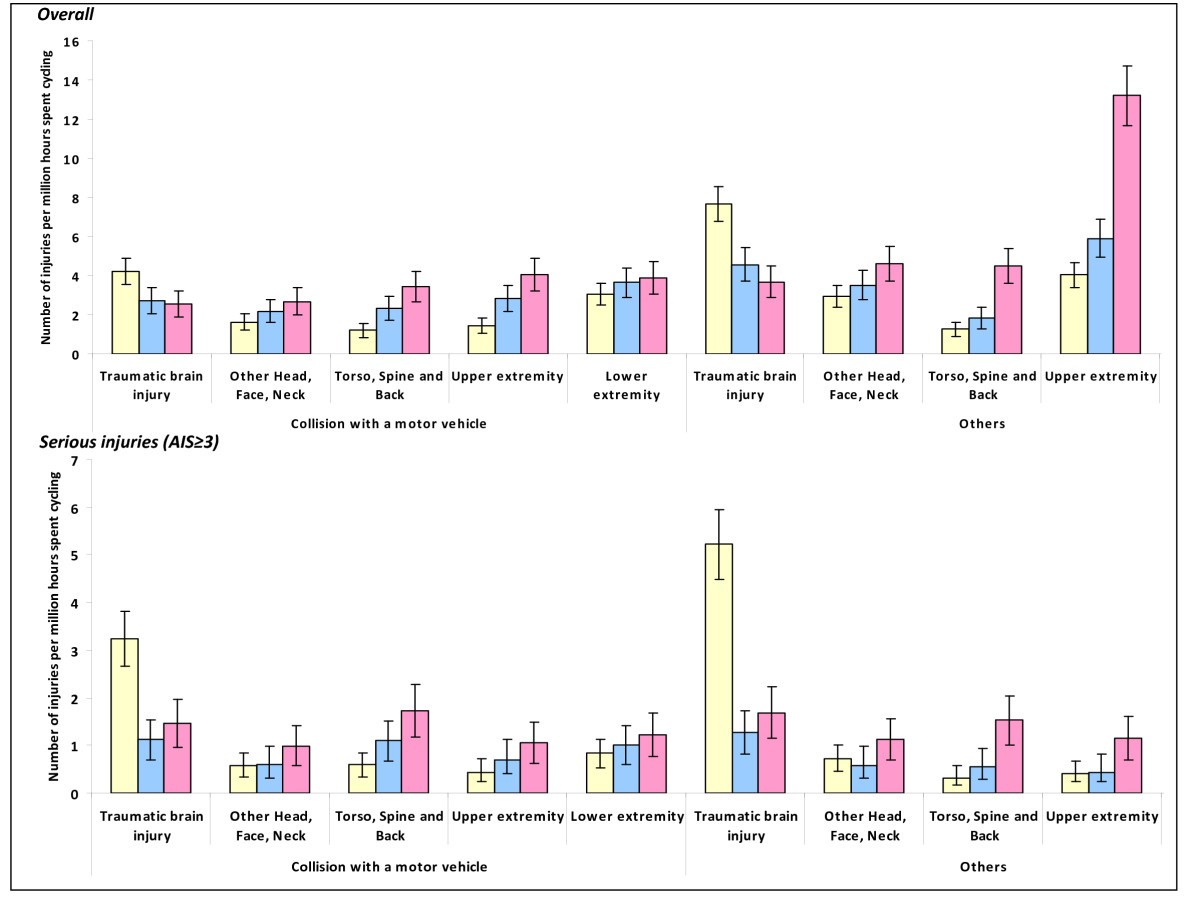
And, most importantly for the question asked above, although he cites and quotes from Tin Tin (2010) he makes no comment on the striking changes in brain injuries as in the figures above: brain injuries went down and injuries to all other sites went up in the period of interest.
Instead he wrote:
"Tin Tin et al18 provided information on the change to ‘upper extremity’ (injuries per million hours cycled) in Figure 3. It increased from 4.4 to 13.20, indicating a 200% higher rate by 2003/07."
The TBI definition is subject to change and the rate of TBI relates to riders age grouping, for NZ the aged 5-17 group had reduced cycling from roughly 23 to 6.4 million hours, down by 72%. The TBI rate for this group can be higher than for adults and they did most of the cycling prior to their helmet law. Also helmets may help reduce TBI in some cases and road safety improved with total road fatalities falling from about 600 in 1993 to 421 in 2007.
It also reports
For New Zealand in five year periods from 1989-93 to 2009-13, the number of cyclist deaths not involving a motor vehicle increased from 9 to 10, 12, 16 and 29.
Data for Canada shows the rates of head injury by age groups, for a similar time period see fig 2, bearing in mind that some parts of Canada have helmet laws for the under 18 age group and there is evidence of reduced cycling where laws are enforced.
https://secure.cihi.ca/free_products/nt ... 2006_e.pdfone point is the average LOS, 6.9 days for cyclists v 11 days nation wide.